| Frontiers | 您所在的位置:网站首页 › low pressure gradient › Frontiers |
Frontiers
ORIGINAL RESEARCH article
Front. Earth Sci., 18 April 2023Sec. Atmospheric Science
Volume 11 - 2023 |
https://doi.org/10.3389/feart.2023.1148506
Urbanization may enhance tornado potential: A single case report Jiwen Fan1*, Jiwen Fan1*,  Jingyu Wang1,2* and Jingyu Wang1,2* and  Yun Lin1,31Pacific Northwest National Laboratory, Atmospheric Sciences and Global Change Division, Richland, WA, United States2National Institute of Education, Nanyang Technological University, Singapore, Singapore3Joint Institute for Regional Earth System Science and Engineering, University of California, Los Angeles, Los Angeles, CA, United States Yun Lin1,31Pacific Northwest National Laboratory, Atmospheric Sciences and Global Change Division, Richland, WA, United States2National Institute of Education, Nanyang Technological University, Singapore, Singapore3Joint Institute for Regional Earth System Science and Engineering, University of California, Los Angeles, Los Angeles, CA, United StatesTornadoes pose a risk of catastrophic economic loss and casualty in the United States. Modification of land use by urbanization alters the meteorological conditions that may impact tornado formation and intensification processes. Here we explored the simulated impact of Kansas City urbanization on the tornado potential of a supercell storm. In this studied case, we found that urbanization might enhance tornado potential by a) strengthening the low-level streamwise vorticity in the storm inflow region, thus forming stronger rotating updrafts; and b) intensifying near-surface horizontal vorticity near the boundary of the forward-flank cold pool which increases the ingestion, tilting, and stretching of streamwise horizontal vorticity into vertical vorticity. The former results from the stronger east-to-west pressure perturbation gradient due to the faster, stronger outflow boundary, and the latter is mainly a result of stronger cold fronts and a better alignment of storm-relative inflow with the horizontal vorticity vector. We emphasize that our conclusions only represent one possibility of how urbanization would affect tornado potential, and a more systematic examination is needed to achieve a more general conclusion. 1 IntroductionTornadoes are one of the most devastating severe weather hazards in the United States, capable of producing significant property damage and casualties (Changnon, 2009). Through decades of scientific exploration of tornadoes and tornado-producing thunderstorms, researchers have made remarkable progress in understanding the characteristics of tornadoes, as well as the physical processes related to tornado formation and intensification (e.g., Lemon and Doswell, 1979; Brooks et al., 1993; Markowski, 2002; Markowski et al., 2002; Wurman et al., 2012; Flournoy et al., 2020). However, few studies have examined how changes in urbanization would be expected to impact supercell and associated tornado activities (Reames and Stensrud, 2018). Urbanization is an extreme case of land use change (Shepherd, 2005) that modifies surface heat, moisture, and momentum exchanges, which in turn alter low-level atmospheric conditions. It is projected that the global urban land coverage will increase by about 6 times, on average, by end of the 21st century compared with 2010, based on intensive fossil-fueled development (Gao and O'Neill, 2020). This rapid urbanization has motivated sustained research on urban meteorology and climate over the past 50 years (Ching et al., 2018). Many previous studies have revealed that urbanization has a notable impact on local weather and climate at all scales (Qian et al., 2022). For example, the urban heat island (UHI), along with altered sensible and latent heat flux, soil moisture, etc., could enhance low-level temperature, turbulence, and convergent mesoscale circulations, which promotes storm initiation and subsequent intensification, increased heavy precipitation, large hail, and stronger convective-scale winds (Bornstein and Lin, 2000; Shepherd, 2005; Hubbart et al., 2014; Haberlie et al., 2015; Liu and Niyogi, 2019; Fan et al., 2020; Javanroodi and Nik, 2020; Singh et al., 2020; Lin et al., 2021). The majority of past studies on urbanization effects investigated precipitation formed from relatively weak convective storms. A few recent modeling studies have explored urbanization impacts on supercell storms interacting with urban areas (Reames and Stensrud, 2018; Lin et al., 2021). Reames and Stensrud (2018) showed that urban areas have a significant impact on low-level rotation and mesocyclone (a meso-gamma scale region of rotation, typically around 3–10 km in diameter) track, but they did not further explore the impact on tornado activity. A long-term analysis of tornado reports showed a correlation between tornado occurrences and land surface heterogeneity—particularly at the boundaries of urban and forested land cover (Kellner and Niyogi, 2014). Higher probabilities of tornado occurrence in urban counties than in rural counties have been reported (Aguirre et al., 1993; Ashley, 2007), although reporting biases due to population density could play a role (Anderson et al., 2007). Early studies have examined long-term climatological near-tornado environments and indicated that low-level moisture content is indispensable for tornadogenesis (e.g., Miller, 1972). Based on this finding, urbanization could be an adverse factor for tornadogenesis because it generally results in a drier planetary boundary layer (PBL). Therefore, process-level studies of the urbanization effect on tornado activities are highly needed. Tornadogenesis and intensity are associated with storm-scale characteristics and processes (e.g., Brooks et al., 1993; Parker, 2014; Davies-Jones, 2015; Flournoy et al., 2020). There are several key processes for tornado formation in supercells. First, the flux of low-level streamwise horizontal vorticity to a convective updraft and the subsequent vertical tilting and stretching forms the mesocyclone and intensifies the mid-low-level updraft (Barnes, 1978; Doswell and Burgess, 1993; Glickman, 2000; Dahl, 2017). Second, to form a tornadic vortex, the near-surface horizontal vorticity, which can be embedded in the large-scale environment and possibly enhanced by low-level baroclinity (Dahl et al., 2014; Markowski and Richardson, 2014; Parker and Dahl, 2015) or surface friction (Schenkman et al., 2014; Roberts et al., 2016), is vertically tilted, stretched, and advected upward by the low-level updraft. The development of near-surface vertical vorticity commonly involves rear-flank downdrafts through the generation of baroclinic vorticity associated with the outflow temperature gradient and augmentation of vortex lines near the ground (Davies-Jones and Brooks, 1993; Markowski, 2002). Thus, many crucial processes governing tornadogenesis are impacted by the low-level wind and thermodynamic fields that may be affected by the underlying surface. Tornado potential has been examined using various parameters in model simulations at convection-permitting scales, for example, storm updraft helicity (UH; the vertical integral of the product of vertical velocity and vertical vorticity) between 2 and 5 km altitudes (Clark et al., 2013) and vertical relative vorticity, as well as the characteristics of the storm environment including wind shear at low levels (Markowski and Richardson, 2014; Sobash et al., 2016) and the significant tornado parameter (STP; Thompson et al., 2012). The STP is a composite index of mixed-layer (ML) lifted condensation level (LCL; the level at which a parcel becomes saturated), convective available potential energy (CAPE; the vertically integrated energy that buoyancy would provide for rising air mass), convective inhibition (CIN; the amount of energy that prevents air parcels from rising), effective storm-relative helicity (ESRH; a measure of the potential for cyclonic updraft rotation relative to a right-moving supercell within the effective inflow layer), and effective bulk wind difference (EBWD; the magnitude of the vector wind difference from the effective inflow base upward to 50% of the equilibrium level height for the most unstable parcel in the lowest 300 mb). STP is calculated as below: STP=MLCAPE1500 J kg−1×ESRH150 m2 s−2×EBWD20 m s−1×2000−MLLCL1000 m×200+MLCIN150 J kg−1(1)By interpreting these variables, the Storm Prediction Center (SPC) issues tornado warnings when the occurrences of tornadoes become imminent (Shafer et al., 2010; Tippett et al., 2012; Clark et al., 2018). Here we explore a possible urbanization effect on the tornado potential of a supercell storm using simulations of an event occurring in Kansas City that was observed during the Plains Elevated Convection at Night (PECAN; Geerts et al., 2017) field campaign on the evening of 1–2 July 2015. This paper continues the work of Lin et al. (2021) (hereafter, “LIN21”), who investigated urbanization effects on storm formation, evolution, and hail occurrences for the same case using numerical simulations. Here, we find that in the studied case the urban area associated with Kansas City might enhance simulated tornado potential through the local enhancement of environmental parameters favorable for supercell tornadoes in the near-storm inflow. 2 Methods2.1 Case descriptionA supercell storm occurred over Kansas City on 1–2 July 2015 (Figure 1C). A series of weak tornadoes with the enhanced Fujita (EF) scale rating of 0 or 1 were reported (Figure 1A). Two of them were reported between 23:33 and 01:07 UTC in Lee’s Summit and west-southwest of the Pleasant Hill Weather Forecast Office, respectively. These tornadoes caused some building damage. The storm developed along a pre-existing east-west-oriented quasi-stationary front located approximately 100 km north of a warm front (Figure 1B), which was produced by the preceding storm on the previous day. Southerly and southwesterly flow at the low levels advected warm, moist air northward into the region, resulting in an unstable environment with surface-based CAPE (SBCAPE) of more than 3800 J kg−1 (LIN21). After the storm initiated in the area northwest of the Kansas City metro area, it traveled southeastward toward the city, intensified, and eventually developed tornadoes. The first confirmed tornado report was EF0 in Raytown (39.01°N, 94.47°W) at 23:33 UTC, followed by the EF1 in Lee’s Summit (38.91°N, 94.38°W) at about 23:51 UTC (Figure 1D). FIGURE 1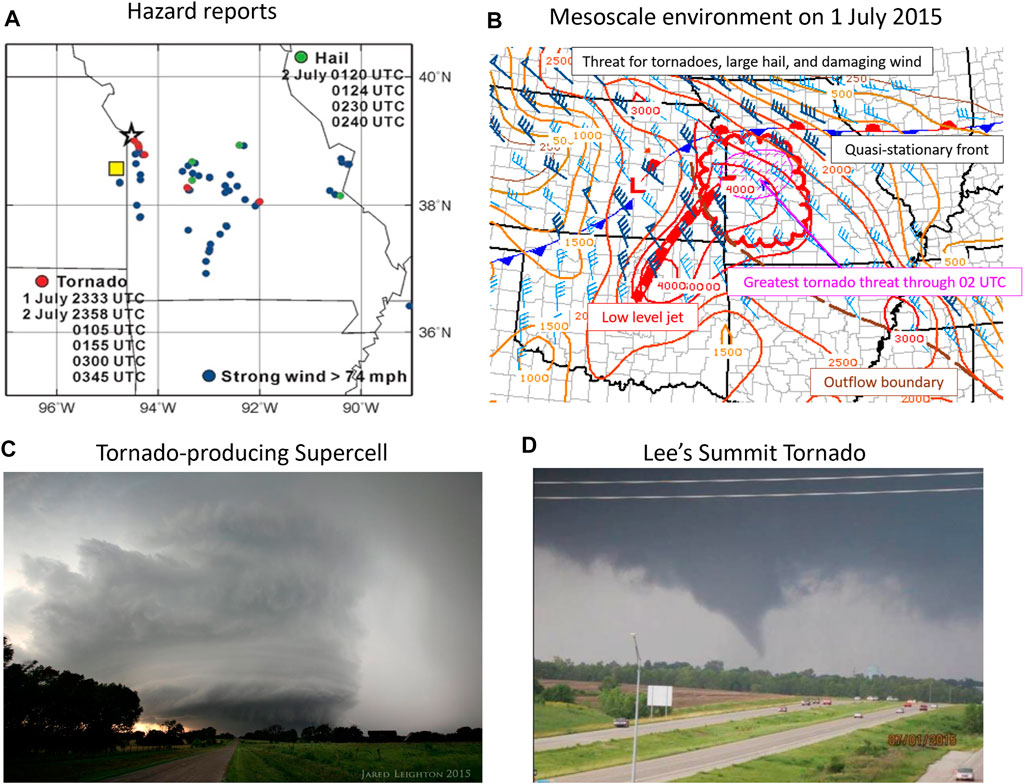 FIGURE 1. (A) The mesoscale environment on 1 July 2015, adapted from the mesoscale discussion #1274 issued by NOAA Storm Prediction Center (https://www.spc.noaa.gov/products/md/2015/md1274.html). LLJ denotes low-level jet. (B) The reports of large hail, tornado, and strong winds from the NOAA Storm Prediction Center (SPC). Photos of (C) the tornado-producing supercell (photo by Jared Leighton, http://slightrisk.net/chase_2015/july_1), (D) the tornado in Lee’s Summit (photo by Christopher Gitro). Before the outbreak of the first tornado, National Weather Service (NWS) issued a tornado watch as shown in Figure 1B (pink area), where the greatest tornado threat has been highlighted over eastern Missouri and eastern Kansas. The supercell, developed along the quasi-stationary front persist from southeast of Kansas eastward through north-central Missouri, grew upscale, and propagated southwestward between the quasi-stationary front and the pre-existing boundary (Figures 1B,C). During the outbreak of the most intense tornado, the tornado-producing supercell demonstrates the typical hook echo structure as seen in many observational archives of tornadic supercells (Markowski, 2002; Markowski et al., 2002; Wurman and Kosiba, 2013). However, the location of the hook echo is around 44 km to the southeast of the first reported tornado touch-down over Kansas City, indicating the tornado case in this study is not much related to the hook echo. As revealed by previous studies (Maddox, 1980; Markowski et al., 1998; Rasmussen et al., 2000; Wurman et al., 2007), a considerable number of tornadoes occurred near low-level boundaries (e.g., synoptic-scale fronts, or outflow boundaries produced by antecedent systems), which are not associated with a forward flank downdraft (FFD) or rear flank downdraft (RFD). The increased tornado potential has been commonly recorded when supercells move along or across those boundaries due to the enhanced low-level wind shear (Schultz et al., 2014), and many significant tornadoes (i.e., EF5) with the devastating outbreak have been formed in such condition (Markowski et al., 1998; Knupp et al., 2014). The studied tornadic supercell case follows this concept. 2.2 Model simulationsThis work leverages simulations described by LIN21. We refer the reader to that study for model details. To briefly summarize the experiment design, the simulations were run at 1-km grid spacing using the Chemistry version of the Weather Research and Forecasting (WRF) model coupled with the spectral-bin microphysics (SBM) scheme (Gao et al., 2016). Urban physics is represented by the multi-layer urban canopy model Building Environment Parameterization coupled with Building Energy Model (BEP+BEM; Martilli et al., 2002; Salamanca and Martilli, 2010). Two simulations are used in this study to examine the urban land effect on tornado potential. One is a baseline simulation with realistic land surface conditions and anthropogenic emissions. In the second simulation, the urban land surface is replaced by the surrounding cropland. These simulations are referred to as “ULandAero” and “No_ULand”, respectively, in LIN21. For simplicity, we have renamed them the “City” and “No-City” simulations, respectively. The baseline simulation (“City”) was verified with observations of precipitation, radar reflectivity, and hail as detailed in LIN21. The evolutions of the observed and simulated storms are compared in Supplementary Figures S2 and S6 of LIN21. Note, LIN21 showed that anthropogenic aerosols did not significantly affect the storm initiation and subsequent development; thus, their effect on the tornado potential is not considered here. Although we do not expect tornadoes to be directly resolved in simulations with a 1-km grid spacing, we do expect that crucial variables and processes impacting the structure and behavior of the parent supercell that may affect tornado potential are adequately represented. Tornado watches are often issued based on the analysis of model simulations conducted with kilometer-scale grid spacings (e.g., Gallo et al., 2016; 2018). 2.3 Diagnostic variables for tornado potentialAs discussed earlier, STP and UH are commonly used for indicating the tornado potential of a storm and its ambient environment. Tornadic environments are typically associated with STP values greater than 1 in the model-derived proximity soundings of Thompson et al. (2007). Gallo et al. (2016); Gallo et al. (2018) forecasted tornadoes from convection-permitting simulations using a combination of environmental parameters such as 2–5-km UH ≥ 75 m2 s−2, STP >1, the ratio of SBCAPE to most unstable CAPE (MUCAPE) greater than 0.75, and SBLCL heights below 1.5 km. We employ these variables to quantify the tornado potential in the simulations. Following the key processes for tornadogenesis associated with supercells discussed in the introduction, we examined streamwise horizontal vorticity and the flux into convective updrafts in two layers: between z = 0.1–1.0 km (“low-levels”), and z = 0.1–0.2 km (the “near-surface” layer). In literature (Flournoy et al., 2020), ‘low-level’ typically refers to 0–1 km above the ground level (AGL), and ‘near-surface’ roughly corresponds to tens of meters above AGL. Here 0.1 km AGL is taken as the bottom level of both layers since there is only one model level below 0.1 km. We calculated the storm-relative streamwise horizontal vorticity (SRSHV) in the near-storm environment, which is the dot product between the horizontal vorticity (i.e., the curl of vertical wind shear) and horizontal velocity vectors: SRSHV=−k→×∂V→∂z∙(V→−c→)≈−k→×Vtop→−Vbot→/Ztop−Zbot∙Vmid→−c→)(2)where V represents the ground-relative wind vector, Z is the height AGL, c is the storm motion vector, and k is the unit vector in the vertical. Subscripts top, mid, and bot represent the upper, middle, and lower height bounds of a prescribed vertical layer over which SRSHV is being evaluated (e.g., 1 km, 0.5 km, and 0.1 km AGL, respectively). SRSHV describes the critical processes for tornadogenesis, which involves the low-level streamwise horizontal vorticity feeding into the convective updraft. It is different from STP - a composite index for tornado potential. 3 Results3.1 Enhanced tornado potentialThe simulated convective storm initiates northwest of Kansas City near the quasi-stationary front at around 21:20 UTC (all times are UTC hereafter). A much larger storm (regarding both spatial coverage and maximum reflectivity, Figure 2A2, D2 vs Figure 2A3, D3) forms in the City run compared to the No-City run (also see Figure 5 of LIN21). As described in LIN21, in the City simulation, the convective cell develops and moves southeastward, and at ∼ 21:40 UTC, it meets with the strong convergence-divergence couplets characteristic of updrafts and their corresponding downdrafts (i.e., secondary circulation) forming at the northern boundary of the city due to stronger moisture and temperature gradients (Figure 8 of LIN21). The convergence-divergence couplets result from the higher low-level temperature and larger urban–rural moisture and temperature gradients at the urban-rural boundaries. These gradients can induce a secondary circulation (Chen and Avissar, 1994; Kang, 2009), as air flows from the cooler to the warmer parts, creating a low-level convergence zone near the interface, and they result from the northward advection of warm and dry air from the city by the southerly-southeasterly low-level winds. The meeting of the convective cell with the convergence-divergence couplets enhances the convection and precipitation, in contrast with the No-City simulation, which lacks the UHI and associated mesoscale convergence pattern (Figure 8 of LIN21). Flow convergence at the northern boundary of Kansas City may also favor updraft development on the flank of the storm nearest to the city, influencing the northerly component of storm motion. Through the examination of the storm evolution depicted by radar reflectivity as shown in Figure 2, the storm traverses the northern and eastern extents of the city for about 2 hours after 21:40 UTC, whereas the storm in the No-City simulation has a more eastward component of motion and a path deviating from the location of Kansas City (also see Figure 6 of LIN21). Note that in all figures the city boundary is marked using gray solid lines for the City simulation and gray dash lines for the No-City simulation. FIGURE 2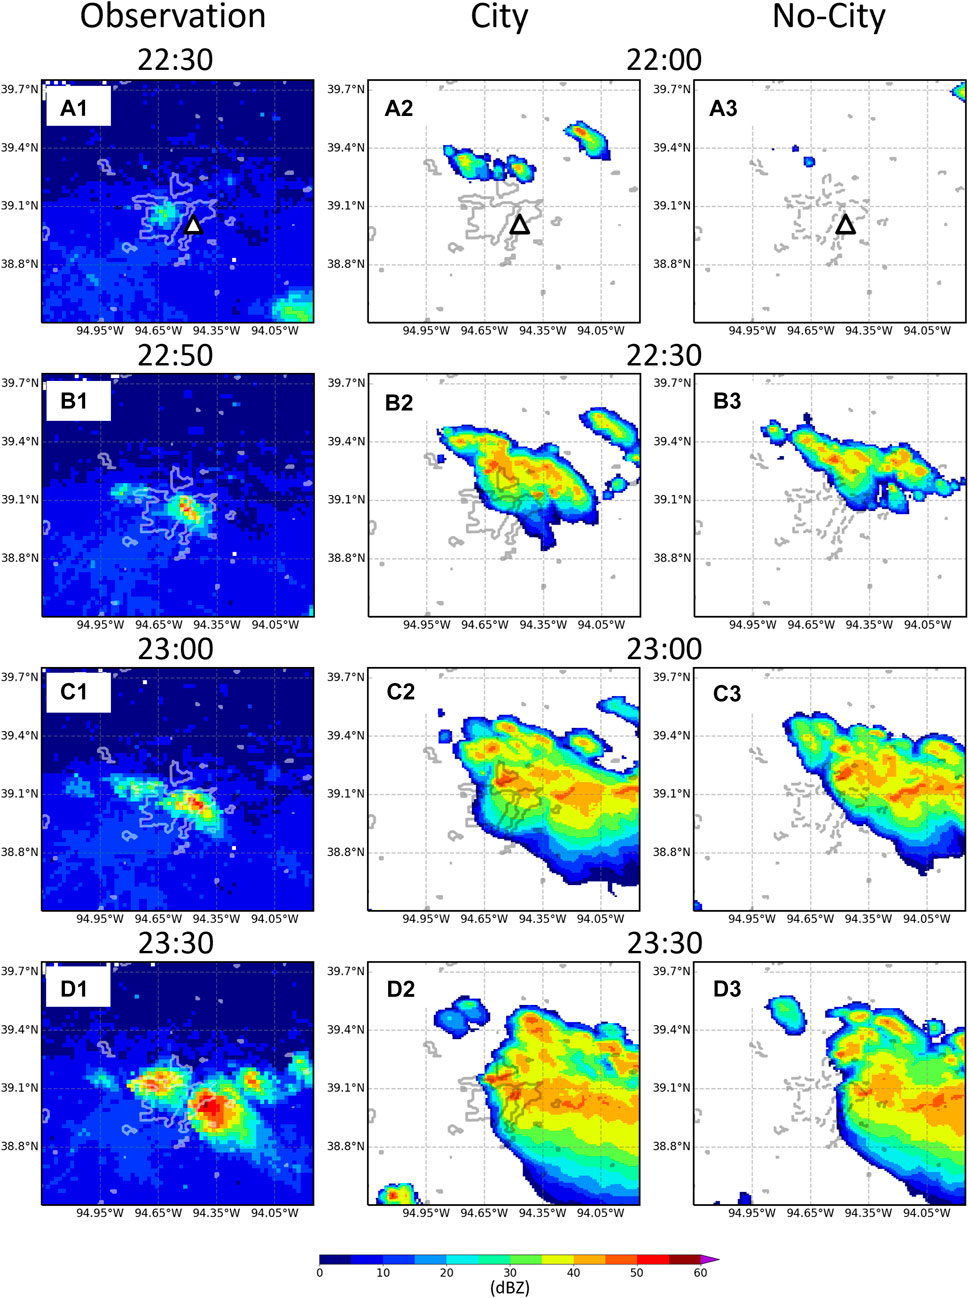 FIGURE 2. Evolution of radar reflectivity for (A1–A3) observation, (B1–B3) City simulation, and (C1–C3) No-City simulation. The time steps are not exactly matched between observation and simulations because the simulated storm initiated about 50 min earlier and grew slower relative to the observed one. The white triangle in (D1–D3) indicates the location of the first tornado report at 23:33 UTC. The low-level UH (calculated from 0.1 to 3 km AGL) and STP begin to show some minor differences between the simulations by 21:40, with higher values in the City case that become discernible by 23:00 (Supplementary Figure S1). At 23:30, close to the time of the first observed tornado, the spatial coverage of the embedded strong radar echoes (>40 dBZ) within the storm in the City simulation is much larger and has expanded more to the southwest than in the No-City case (Figure 3A1, A2). STP is ∼2.0 in the storm inflow region to the south-southeast of the updraft core, approximately 1.0 larger than in the No-City simulation (Figure 3B1, B2). Further, UH in the convective core (>45 dBZ) is greater in the City simulation (>250 m-2 s-2) than in the No-City simulation (∼150 m-2 s-2; Figure 3C1, C2). The greater STP and UH values in the City case suggest that tornado potential is enhanced by the parent storm’s response to the Kansas City urbanization. Although SBLCL heights in the urban area in the City case are about 300 m larger than those in the No-City case (Supplementary Figures S2,S3), they are all below 1.5 km and SBCAPE/MUCAPE ∼1.0 for both cases, meeting the criteria for elevated tornado potential used by Gallo et al. (2016); Gallo et al. (2018) (see section 2.3). FIGURE 3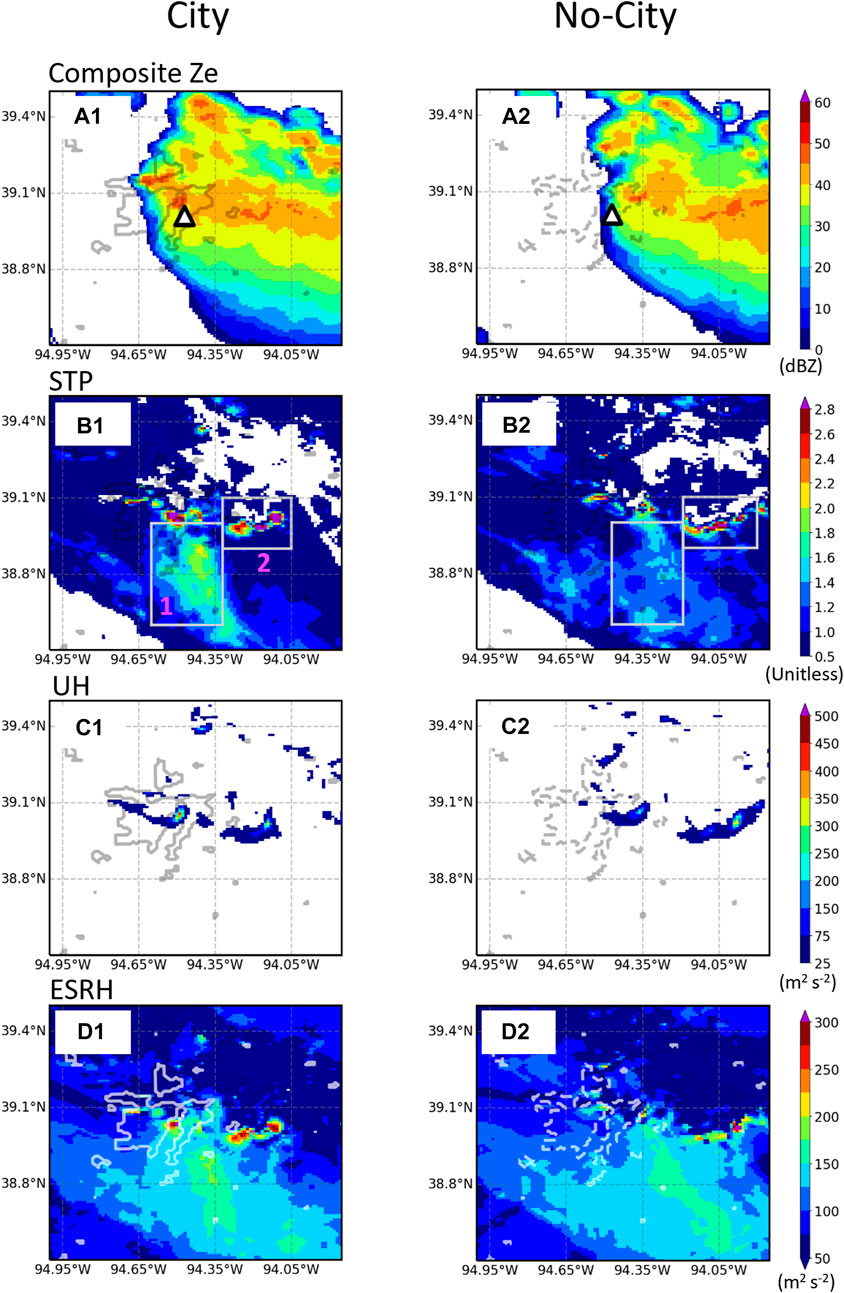 FIGURE 3. Comparisons in (A1,A2) composite radar reflectivity, (B1,B2) significant tornado parameter (STP), (C1,C2) 100m-3 km updraft helicity, and (D1,D2) effective storm-relative helicity (ESRH) between the City (left column) and No City (right column) simulations at 23:30 UTC. The white triangle in (A1,A2) indicates the location of the first tornado report at 23:33 UTC. The white boxes in (B1,B2) denote regions 1 and 2. There are two regions with larger STP in the low-level inflow to the storm that correspond to two critical processes for tornadogenesis (regions 1 and 2, denoted with white boxes in Figure 3B1). Region 1 includes the ambient inflow area, where barotropic low-level streamwise horizontal vorticity associated with vertical shear of the horizontal wind is advected into the convective updraft. The first observed Raytown tornado (EF0) occurred north of this region (the white triangle in Figure 3A1). In the City case, STP in region 1 increases northward and peaks near the city (>2.0; Figure 3B1). However, the STP values in the corresponding region in No-City are smaller (2.0) and has a larger spatial coverage in the City simulation than in the No-City simulation; again, due to greater ESRH (Supplementary Figures S2, S3). As in region 1, SBLCL in region 2 of the City case is greater, and SBCAPE and SBCIN are smaller compared to the No-City case. However, these differences are much smaller compared with region 1 because this region is embedded in the convective core of the storm, where the strong vertical motions dominate the signature of vertical wind shear. 3.2 Mechanisms for enhanced tornado potentialThe formation of the low-level rotation by the tilting and stretching of low-level streamwise horizontal vorticity within the updraft is typically considered a prerequisite for tornadogenesis. The SRSHV at 23:30 is shown in Figure 4A1, A2. The contrast in SRSHV between the two simulations matches well with their contrast in STP, with much higher values in the City simulation in region 1 (by ∼60 × 10−3 m s-2, or ∼40%) and region 2 (Figure 4A3). By matching SRSHV in Figure 4A1 with the maximum low-level updraft in the City case (Figure 4B1), we can see that the SRSHV flow is feeding into updrafts at the location of the first reported tornado as clearly shown in Figure 4C1, facilitating the formation and intensification of the low-level rotating updraft. However, in the No-City case, SRSHV is much weaker and does not flow into the updrafts (Figure 4B2,C2); therefore, the supply of low-level horizontal vorticity into the convective updraft is weaker and perhaps less favorable for tornadogenesis processes than in the City case. FIGURE 4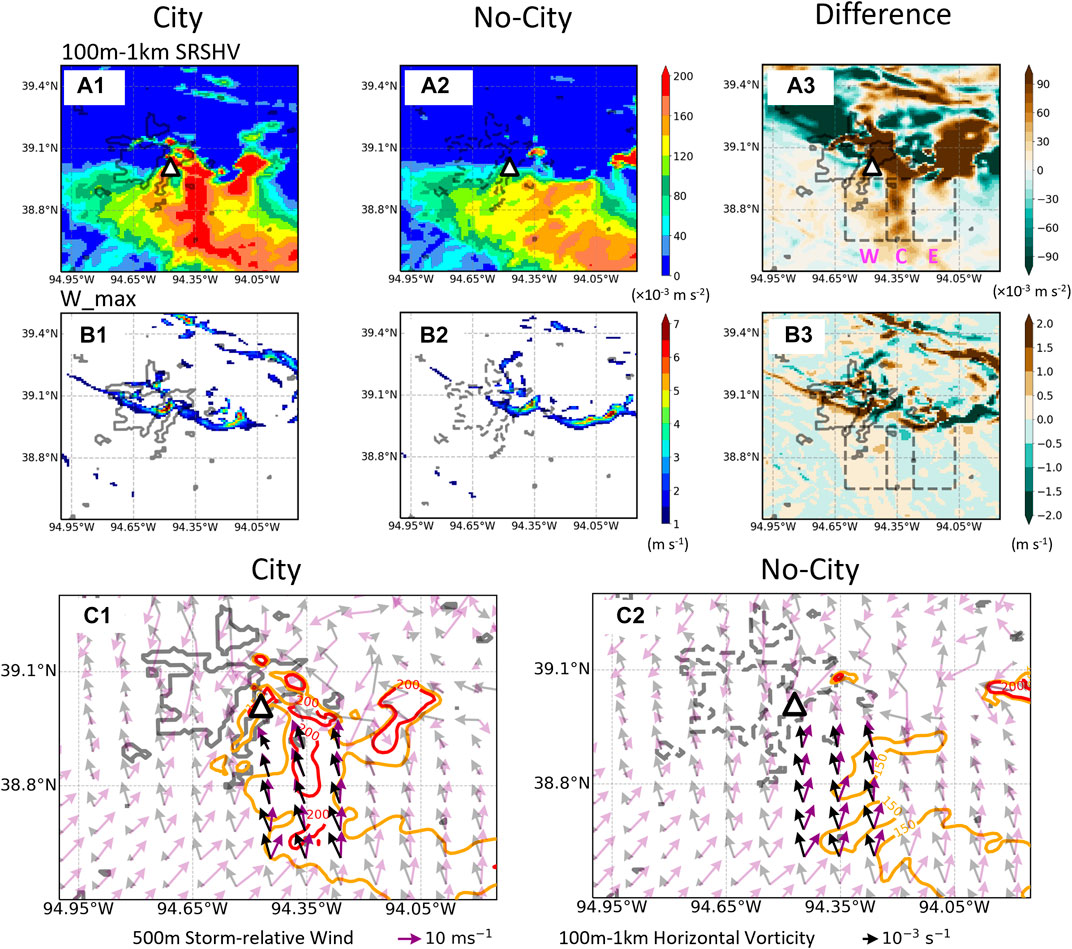 FIGURE 4. Storm-relative streamwise horizontal vorticity (SRSHV) within 100m-1 km for (A1) City, (A2) No-City, and (A3) the difference between City and No-City at 23:30 UTC. (B1–B3) same as (A1–A3) except for the maximum vertical velocity below 1 km above ground level (AGL). The composite diagnostic maps are shown for (C1) City and (C2) No-City simulations, where the 500 m storm relative wind (purple barbs) and 100m-1 km horizontal vorticity (black barbs) are overlaid on the SRSHV (contour). Note that barbs within the inflow region of area C are highlighted. To understand the physical processes resulting in larger SRSHV in the ambient inflow region south-southeast of the updraft of the City case, we divide this region into three portions, the ‘center’ area with the largest difference in SRSHV, and its adjacent areas on the west and east (areas C, W, and E, respectively, in Figure 4A3). SRSHV has two components, the horizontal storm-relative wind vector in the middle of the layer (500 m, Figure 5B1–B3) and the horizontal vorticity vector calculated between the top (Figure 5C1–C3) and bottom (Figure 5A1–A3) of the 0.1–1 km layer. The 500-m storm-relative winds in area C are stronger and oriented more southeasterly in the City simulation than in the No-City simulation (Figure 5B1–B3 and purple vectors in Figure 4C1, C2). Though horizontal vorticity vectors in area C are oriented similarly across both cases, the magnitude is greater in the City case (about 35% mean increase over area C at 23:30). This is more clearly shown in the time series (Figure 6A) and is also reflected in the vertical wind shear between 0.1–1 km (Figure 6B). Thus, greater SRSHV in the City case is a result of slightly enhanced storm-relative inflow that is much better aligned with the orientation of stronger horizontal vorticity. FIGURE 5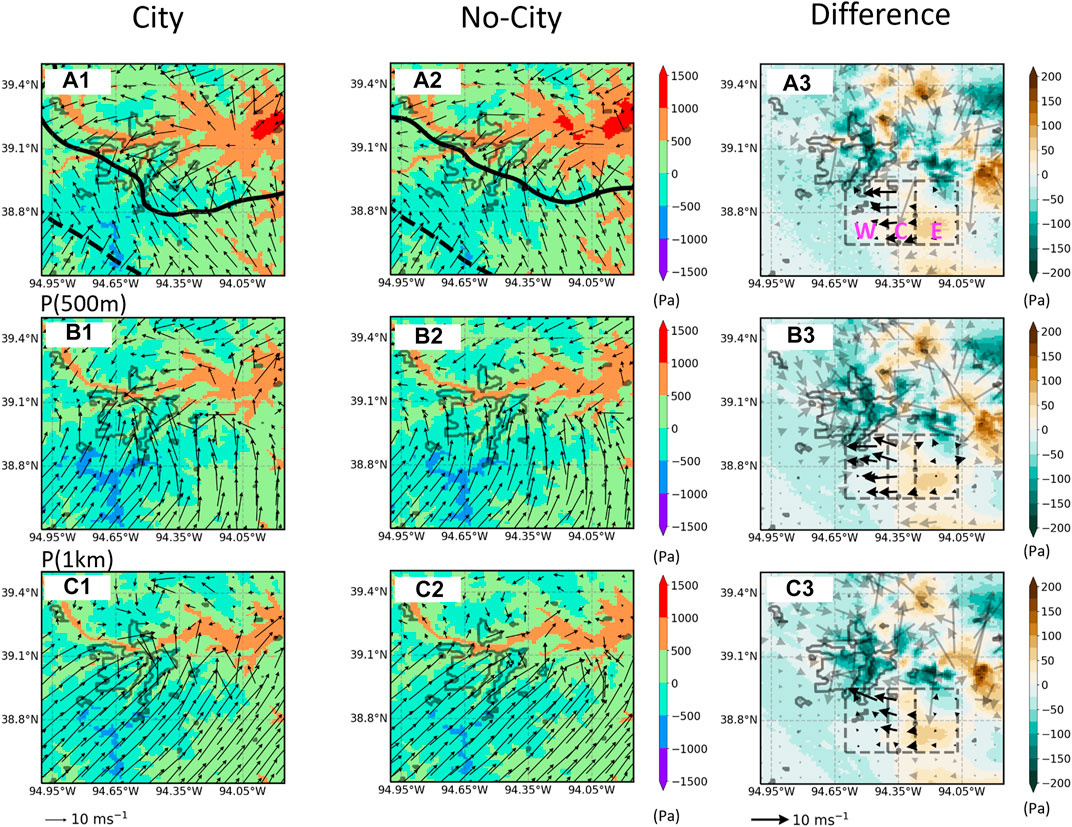 FIGURE 5. Pressure perturbation (contour; calculated by subtracting the mean pressure of the in-flow area (95.25°- 93.85°W, 38.5°- 39.75°N) and wind field (barbs) at 100 m AGL for (A1) City, (A2) No-City, and (A3) the difference between City and No-City at 23:30 UTC. (B1–B3) and (C1–C3) are the same as (A1–A3), except for 500m and 1 km AGL. The black lines on (A1,A2) indicate the 33°C (dashed) and 30.5°C (solid) isotherms. The difference in winds is plotted for the storm-relative winds. The boxes on (A3,C3) are the same as those in Figure 4A3. FIGURE 6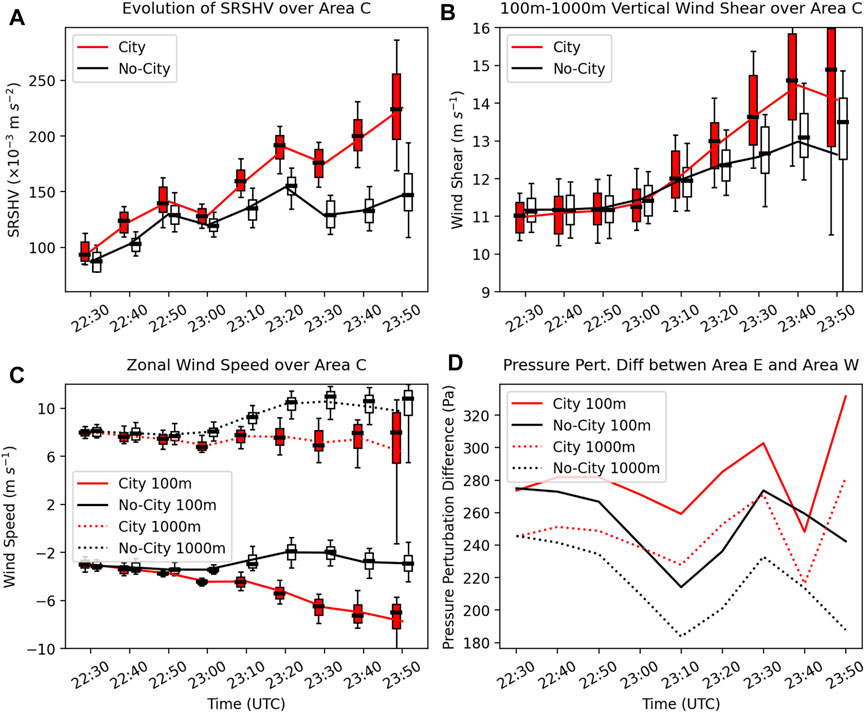 FIGURE 6. Comparison between City and No-City in the temporal evolutions of (A) SRSHV, (B) vertical wind shear within the 100m-1 km layer in area C, (C) the zonal wind speed at 100m and 1 km in area C (easterly is negative and westerly is positive), and (D) the difference in pressure perturbation between area E and area W at 100 m and 1 km. The lines represent the domain average values, while the box plots show the 5th percentile value (lower whisker), 25th percentile value (bottom of the box), median value (center of the box), 75th percentile value (top of the box), and 95th percentile value (upper whisker) of all the grid elements within the selected area. Now the question is how the vertical wind shear (and associated horizontal vorticity) and storm-relative inflow are greater in the City case than in the No-City case. We examine the pressure perturbation fields and wind fields at the bottom (100 m AGL), middle (500 m), and top (1 km) layers (Figure 5). At 100 m AGL, area C is dominated by southeasterly winds in both simulations (Figure 5A1–A3). The mean wind in this area veers southerly at the middle layer (500 m) (Figures 5B1–B3), and finally southwesterly at the top layer (Figure 5C1–C3). Over area C, the City case contains stronger easterly winds at 100 m (Figure 5A3) and weaker westerly winds at 1000 m than the No-City case (Figure 5C3). The magnitude of the zonal wind difference between City and No-City is larger at the bottom layer than that at the top of the layer (Figure 5A3 vs Figure 5C3). This leads to the larger bulk wind shear (Figure 6B) and subsequently higher horizontal vorticity (black barbs, Figure 4C1,C2). Stronger easterly winds at the bottom of the layer and weaker westerly winds at the top layer in area C in the City case are associated with the stronger westward-oriented perturbation pressure gradient (PPG) acting across area W and E than in the No-City case (Figure 5A3). Although a similar qualitative pattern of pressure perturbation differences is also found in the middle layer (Figure 5B3) and the top layer (Figure 5C3), the PPG is stronger at the bottom layer compared with the elevated layers (Figure 6D), explaining the larger increase in the magnitude of winds. Time evolution plots show that the stronger easterly wind at the bottom layer (Figure 6C; easterly is negative and westerly is positive), greater wind shear (Figure 6B), and larger SRSHV (Figure 6A) become prominent after 23:10. The largest differences in wind shear and SRSHV between the two simulations occur between 23:30–00:00 when a series of tornados were reported. How is the pressure perturbation higher in area E and lower in area W in the City simulation compared to the No-City simulation (differences of 14.4 pa and −14.7 pa, respectively)? An outflow boundary (represented by the 30.5°C isotherm in Figure 7) propagates southwestward as the supercell evolves in both simulations. It is noteworthy that the cold pool in the City simulation has higher intensity and larger coverage than the No-City simulation throughout the lifecycle of the storm from 22:00 (Supplementary Figure S5). As the outflow boundary (bold black line in Figure 5A1, A2) travels southward, a positive pressure perturbation develops ahead of it in the ambient inflow in area E. Although the causes of this positive perturbation pressure are unknown and beyond the scope of this paper, its presence is consistent with past schematic models and idealized simulations containing dynamically-induced high pressure leading to an outflow gust front (e.g., Wakimoto, 1982; Markowski and Richardson, 2010). This pressure perturbation is stronger in the City simulation than in the No-City simulation because of its colder outflow and faster motion toward the south (Figure 7A vs Figure 7B). At 23:30 UTC in the City case, the outflow boundary has already passed area E and is moving through area W, but in No-City it has not yet arrived at area E; hence the pressure perturbation is increased in area E in the City simulation as shown in Figure 5A3,C3. Lower pressure in area W in the City simulation may be associated with enhanced inflow drawn by a stronger core storm updraft. The increased pressure perturbation in area E and decrease in area W leads to the larger zonal PPG, resulting in the enhanced easterly wind at the bottom layer (100 m) and subsequently the strong vertical wind shear and streamwise vorticity within 100 m—1 km in area C. Meanwhile, the storm-relative inflow at the middle layer (purple barbs, Figure 4C1, C2) is also better aligned with the vorticity vector (i.e., much smaller angles between the purple and black bards compared with the No-City case), which also contributes to the enhanced SRSHV in City simulation. Note the storm-relative inflow speed is not changed significantly from the City to No-City case (purple bards between Figure 4C1, C2). The better alignment probably results from the stronger PPG at 500 m as well (Figure 5B1–B3). This result may be consistent with past studies showing increases in low-level shear and storm-relative helicity in proximity to supercell thunderstorms, in part due to low-level inflow acceleration by the storm updraft (e.g., Nowotarski and Markowski, 2016; Wade et al., 2018). In addition to PPG, the altered wind pattern and the subsequent production of horizontal vorticity in City simulation could also be influenced by the friction from the planetary boundary layer procession due to the surface roughness change. However, since the BEP + BEM urban canopy model used in this study considers the building energy effects, changing surface roughness is not a straightforward task and it will also impact energy. Therefore, we are not able to separately look at the contribution from the changes in surface roughness in this study. FIGURE 7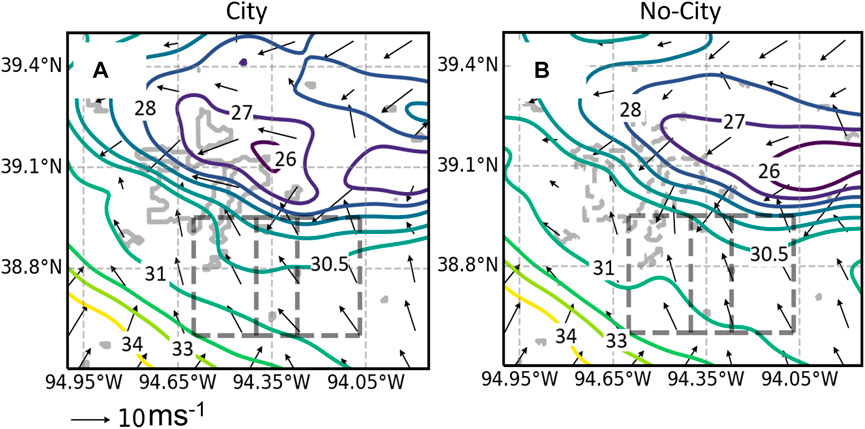 FIGURE 7. Temperature (contoured line) and wind vectors (arrow) 23:30 UTC at 100 m AGL for (A) City and (B) No-City simulations. In summary, the enhanced low-level SRSHV over the storm inflow region in the City case is a result of the combined effects of 1) greater horizontal vorticity induced by the enhanced pressure perturbation gradient, and 2) a storm-relative wind vector that is better aligned with the vorticity vector. Both factors are closely related to the faster southwestward propagation of a stronger outflow boundary in City simulation which causes a stronger PPG gradient. The stronger outflow boundary in the City case is a result of stronger storm caused by the urban land effect, which produces stronger turbulence and secondary circulation due to the downwind advection of urban heat and large temperature and moisture gradients at the urban-rural boundaries (LIN21). The faster southwestward propagation of the storm in the City case is because the secondary circulation at the northern urban-rural boundaries diverts the pre-existing storm toward the city (more details are presented in LIN21). 3.3 Near-surface rotation and its intensificationThe advection, tilting, and stretching of near-surface horizontal vorticity by the low-level updraft is critical for tornadogenesis. As discussed earlier, there is an area of enhanced STP and UH values located east of the urban area in the City case compared to the No-City case (region 2; Figure 3B1, B2 and Figure 3C1, C2). This region of higher STP is collocated with the southeast edge of the low-level mesocyclone (Figure 8A1). By zooming into the eastern part of the urban area, we can see that a mesocyclone forms in the City case (purple circle in Figure 8A1, the enclosed vertical vorticity exceeds 400 × 10−5 s-1). A similar mesocyclone is also found in the No-City simulation but its location is shifted to the east (green circle in Figure 8A2), corresponding to the eastward shift of the storm path compared with the City case, as detailed in LIN21. When comparing with the middle-level mesocyclone (Figure 8B), we can see the near-surface maximum vorticity well aligns with its counterpart at mid-level in the City case (the purple cycle in Figure 8B1 vs Figure 8A1). However, for the No-City case, the mid-level vorticity center is shifted eastward away from the near-surface mesocyclone (the green cycle in Figure 8B2 vs Figure 8A2). This is consistent with several studies that indicate that the potential for tornadogenesis is reduced with an increasing vertical tilt of the mesocyclone and updraft (e.g., Dowell and Bluestein, 2002; Marquis et al., 2012). FIGURE 8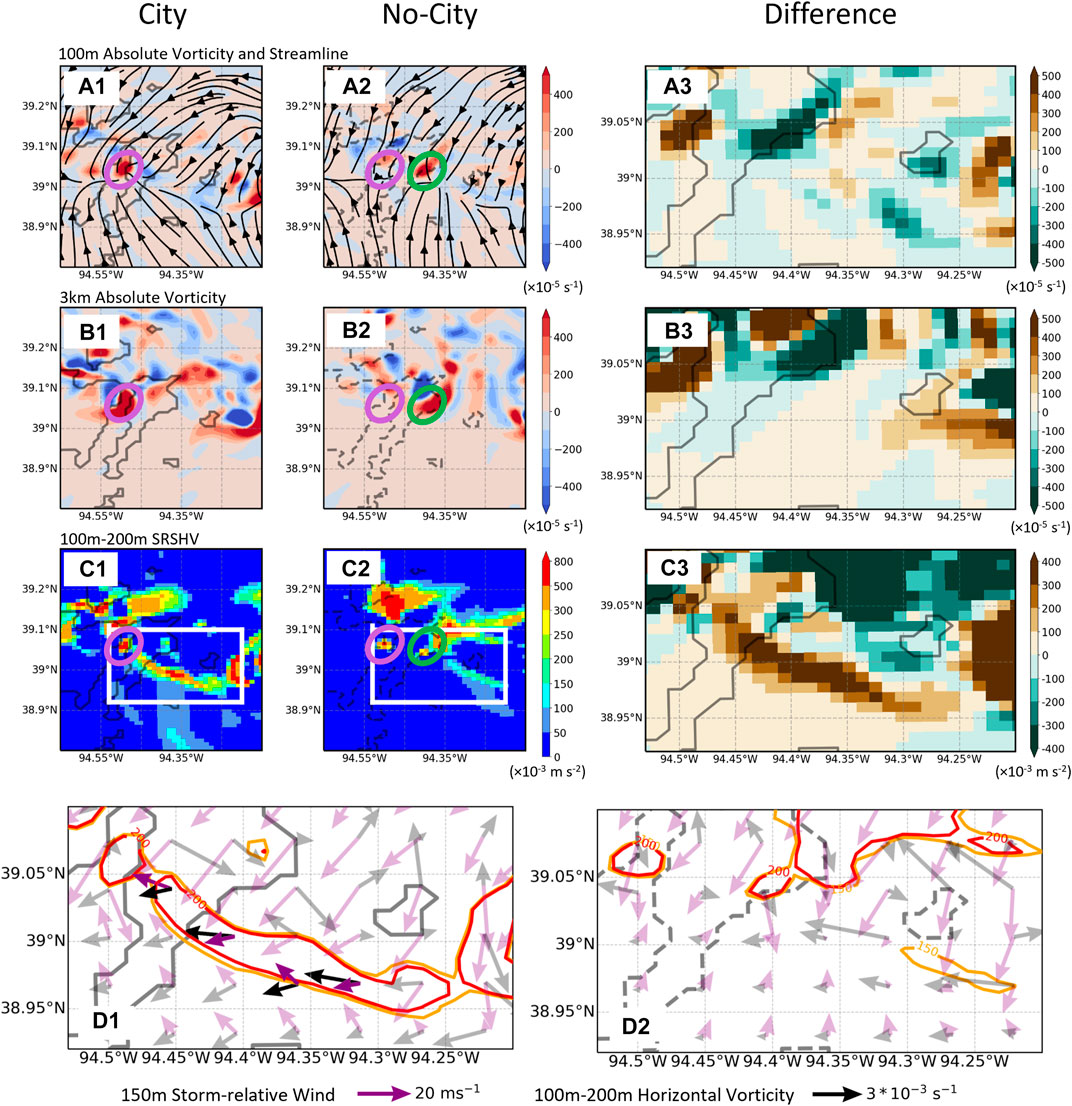 FIGURE 8. The 100 m absolute vorticity (contour) and streamline for (A1) City simulation, (A2) No-City simulation, and (A3) their difference (City—No-City) at 23:30 UTC. (B1–B3) are same as (A1–A3), except for 3 km absolute vorticity. (C1–C3) 100m–200 m storm-relative streamwise horizontal vorticity (SRSHV). The purple and green circles on (A1,A2), (B1,B2), and (C1,C2) indicate the locations of near-surface mesocyclone for City and No-City simulations, respectively. The white boxes on (C1,C2) highlights the zoom-in domain used in (A3,C3) and (D1,D2). The composite diagnostic maps are shown for (D1) City and (D2) No-City simulations, where the 150 m storm-relative wind (purple barbs) and 100 m–200 m horizontal vorticity (black barbs) are overlaid on the SRSHV (contour). Note that barbs within the inflow region along the thermal boundary are highlighted in D1. The near-surface SRSHV (100–200 m AGL) in region 2 upstream of the main updraft and mesocyclone is stronger in the City case than in the No-City case (Figure 8C1–C3). Again, we decompose SRSHV into the horizontal vorticity component (vertical wind shear; Figure 9A1–A3) and the storm-relative horizontal wind component (horizontal wind, Figure 9B1–B3). Given the fact that the band of enhanced SRSHV is approximately aligned with the easterly wind, only the meridional component of the wind shear is examined in Figure 9A1–A3, and similarly, their difference in storm-relative zonal wind component is examined in Figure 9B1–B3. The difference in storm-relative easterly winds between the City and No-City simulations is more substantial than the difference in the wind shear (Figure 9B3 vs Figure 9A3). Therefore, different from region 1, where the larger SRSHV is driven by differences in the magnitude and orientation of both the horizontal wind and vorticity vectors, in region 2, the enhanced near-surface SRSHV in the City case is mainly caused by the increase in the easterly storm-relative inflow wind speed as well as a more widespread alignment of orientation with the horizontal vorticity vector (Figure 8D1 vs D2). FIGURE 9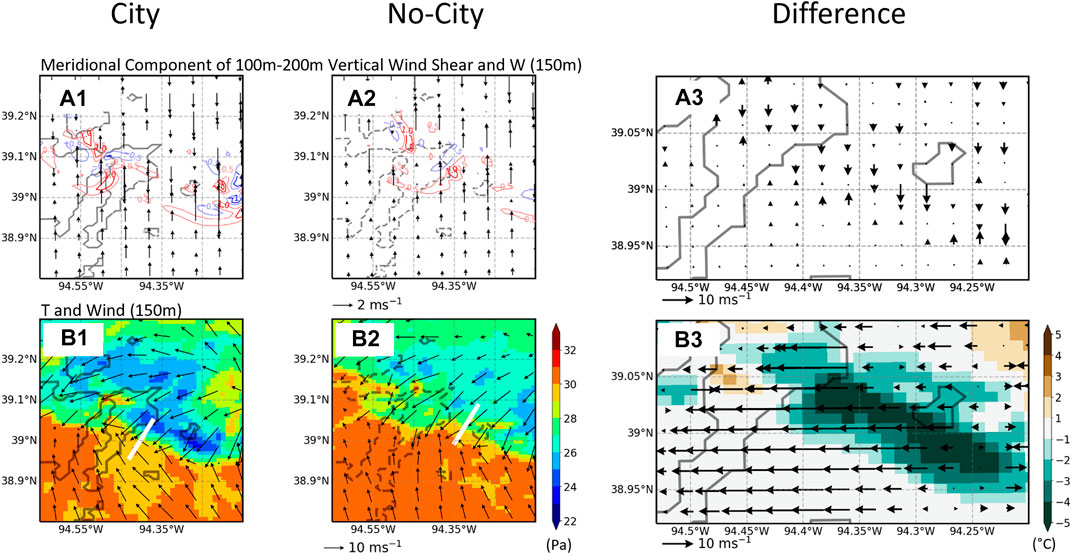 FIGURE 9. Vertical velocity at 150 m (contour lines) overlaid on the meridional component of 100m–200 m vertical wind shear (barbs) for (A1) City, (A2) No-City, and (A3) the difference between City and No-City at 23:30 UTC. (B1–B2) 150 m temperature (contour) and wind (barbs) fields. (B3) Shows the difference in the storm-relative zonal wind. The temperature gradients in the two simulations are calculated along the white lines in (B1) and (B2) respectively. Through the joint examination of the concurrent temperature field (Figure 8C; Figure 9B), the increased southeasterly winds are oriented along the boundary of the temperature contrast in the City simulation whose temperature gradient (as indicated by the white line) reaches 0.7°C/km. The temperature contrast in the No-City simulation is only ∼0.1°C/km. It is expected that the stronger temperature gradient in the City case results in the increased baroclinic generation of horizontal vorticity in this region compared to the No-City case. However, increased inflow winds in the City case may temper the portion of SRSHV generated by baroclinic processes because of reduced parcel residence time within the temperature gradient zone. Regardless, the stronger horizontal pressure perturbation gradients ahead of the cold pool in the City case (Figure 5A3) increase SRSHV due to accelerated southeasterly winds. The stronger thermal gradient (i.e., stronger cold pool) in the City case should be due to the stronger precipitation and convective downdrafts. 4 DiscussionWe investigate a possible role played by urbanization in enhancing tornado potential by using a pair of high-resolution simulations of a tornadic supercell, one including urbanized land use representing Kansas City and another that replaces Kansas City with cropland similar to its surroundings. We find that urbanization might enhance tornado potential by influencing two key mesoscale and storm-scale processes (summarized in Figure 10). In these simulations, urbanization yielded a larger supercell storm with stronger updrafts and precipitation than in the case without the urban region. This stronger and larger storm occurred because of the secondary circulation at the downwind urban-rural boundaries at its initial and developing stages, as discussed in LIN21. The stronger storm leads to colder outflow that moves faster toward the south. A larger west-to-east pressure perturbation gradient is generated ahead of the cold pool in the ambient inflow of the City case, resulting in stronger easterly winds. As a result, greater low-level (below 1 km) streamwise vorticity is produced ahead of the storm, enhancing the low-level rotating updraft. Without the city, the storm is weaker and its motion is shifted eastward from the path taken in the City case; thus, the outflow from the storm in the No-City case is weaker and moves southward at a slower speed. These differences lead to a weaker horizontal pressure gradient ahead of the cold pool; thus, smaller wind shear and SRSHV changes in the inflow. Further, differences in overall storm motion result in a different storm-relative helicity in the ambient inflow of the City storm. FIGURE 10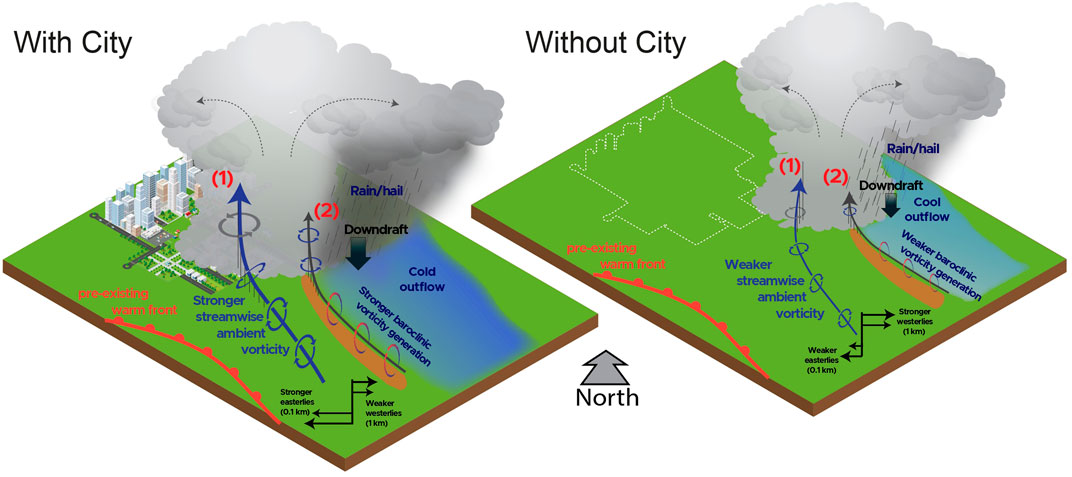 FIGURE 10. Urbanization enhances the tornado potential through two pathways: (1) enhanced low-level SRSHV feeding updrafts due to stronger east-west pressure perturbation gradient as a result of faster, stronger storm outflow, and (2) intensified near-surface SRSHV which is more aligned with the easterly storm-relative inflow because of stronger cold pool front which increases southeasterly winds. Both pathways are associated with a stronger storm at the initial and developing stages resulting from the Kansas City urbanization. Also, the low-level rotation (i.e., SRSHV) was enhanced near the boundary of the forward-flank cold pool region, because the outflow in the City case is colder than in the No-City case (i.e., colder cold pool). It was unclear if this enhancement was due in part to increase baroclinic generation of horizontal vorticity. Regardless, in this area the easterly storm-relative inflow wind speed was increased and horizontal vorticity vectors were better aligned with the easterly storm-relative inflow than in the No-City case, increasing the SRSHV that is ingested into, tilted, and stretched by the primary updraft to generate substantial vertical vorticity. Without the city landscape, cold pools are much weaker, resulting in weaker low-level temperature gradients, weaker southeasterly inflow winds, and smaller SRSHV which is not well aligned with the storm-relative inflow. In summary, in the studied case, the enhancement in tornado potential for the storm with the Kansas City urbanization considered is aided by both the enhanced SRSHV in the low-level inflow region and the storm’s forward flank cold pool region near the surface. Both of these enhancements result from the enhanced storm and altered storm path by the Kansas City urbanization because of the downwind advection of urban heat and large temperature and moisture gradients at the urban-rural boundaries. The mechanisms leading to the enhanced tornado potential by urban land use in this study involve mesoscale and storm-scale processes that are general intrinsic properties of supercell storms. Therefore, we believe this study should be instructive in exploring urbanization impact on tornadoes in other supercell storms. However, we emphasize that these conclusions may differ by urban structure, different initial or boundary meteorological conditions, or the time and location that a storm encounters the urban zone. Due to the large computational cost associated with our simulations with detailed physics, we were not able to do ensemble simulations. Thus, the result presented in this study only represents one possibility of how urbanization would affect tornado potential, and a more systematic examination is needed to achieve a more general conclusion. Data availability statementThe raw data supporting the conclusion of this article are available at https://portal.nersc.gov/archive/home/w/wang406/www/Publication/Fan2023FES/WRF_Tornado.tar.gz. Author contributionsJF conceived the idea and guided the work, JW performed the formal analysis and wrote the first draft of the manuscript. YL performed the model simulations used in this study. All authors contributed to manuscript revision and approved the submitted version. FundingThis study is supported by the U.S. Department of Energy Office of Science Early Career Research Program (Grant no. 70017). JW is supported by the Ministry of Education, Singapore, under its Academic Research Fund Tier 1 (RG74/22). AcknowledgmentsPNNL is operated for the U.S. Department of Energy (DOE) by Battelle Memorial Institute under contract DE-AC05-76RL01830. This research used resources of the PNNL Institutional Computing (PIC), and National Energy Research Scientific Computing Center (NERSC). NERSC is a U.S. DOE Office of Science User Facility operated under Contract DE-AC02-05CH11231. We thank James Marquis from PNNL for the discussion and revision of the manuscript. Conflict of interestThe authors declare that the research was conducted in the absence of any commercial or financial relationships that could be construed as a potential conflict of interest. Publisher’s noteAll claims expressed in this article are solely those of the authors and do not necessarily represent those of their affiliated organizations, or those of the publisher, the editors and the reviewers. Any product that may be evaluated in this article, or claim that may be made by its manufacturer, is not guaranteed or endorsed by the publisher. Supplementary materialThe Supplementary Material for this article can be found online at: https://www.frontiersin.org/articles/10.3389/feart.2023.1148506/full#supplementary-material ReferencesAguirre, B. E., Saenz, R., Edmiston, J., Yang, N., Agramonte, E., and Stuart, D. L. (1993). The human ecology of tornadoes. Demography 30, 623–633. doi:10.2307/2061810 PubMed Abstract | CrossRef Full Text | Google Scholar Allen, J. T., Tippett, M. K., and Sobel, A. H. (2015). An empirical model relating U.S. monthly hail occurrence to large-scale meteorological environment. J. Adv. Model. Earth Syst. 7, 226–243. doi:10.1002/2014MS000397 CrossRef Full Text | Google Scholar Anderson, C. J., Wikle, C. K., Zhou, Q., and Royle, J. A. (2007). Population influences on tornado reports in the United States. Wea. Forecasting 22, 571–579. doi:10.1175/waf997.1 CrossRef Full Text | Google Scholar Ashley, W. S. (2007). Spatial and temporal analysis of tornado fatalities in the United States: 1880–2005. Wea. Forecasting 22, 1214–1228. doi:10.1175/2007WAF2007004.1 CrossRef Full Text | Google Scholar Barnes, S. L. (1978). Oklahoma thunderstorms on 29–30 April 1970. Part I: Morphology of a tornadic storm. Mon. Wea. Rev. 106, 673–684. doi:10.1175/1520-0493(1978)1062.0.CO;2 CrossRef Full Text | Google Scholar Bornstein, R., and Lin, Q. (2000). Urban heat islands and summertime convective thunderstorms in Atlanta: Three case studies. Atmos. Environ. 34 (3), 507–516. doi:10.1016/S1352-2310(99)00374-X CrossRef Full Text | Google Scholar Brooks, H. E., Doswell, C. A., and Davies-Jones, R. P. (1993). “Environmental helicity and the maintenance and evolution of low-level mesocyclones,” in The tornado: Its structure, dynamics, prediction, and hazards, geophys. Monogr., No. 79. (Washington, D.C: Amer. Geophys. Union), 97–104. CrossRef Full Text | Google Scholar Brown, M. C., and Nowotarski, C. J. (2020). Southeastern U.S. tornado outbreak likelihood using daily climate indices. J. Clim. 33 (8), 3229–3252. doi:10.1175/jcli-d-19-0684.1 CrossRef Full Text | Google Scholar Changnon, S. A. (2009). Tornado losses in the United States. Nat. Hazards Rev. 10 (4), 145–150. doi:10.1061/(asce)1527-6988(2009)10:4(145) CrossRef Full Text | Google Scholar Chen, F., and Avissar, R. (1994). Impact of land-surface moisture variability on local shallow convective cumulus and precipitation in large-scale models. J. Appl. Meteor. 33, 1382–1401. doi:10.1175/1520-0450(1994)033,1382:IOLSMV.2.0.CO;2 CrossRef Full Text | Google Scholar Ching, J., Mills, G., Bechtel, B., See, L., Feddema, J., Wang, X., et al. (2018). Wudapt: An urban weather, climate, and environmental modeling infrastructure for the anthropocene. Bull. Am. Meteorol. Soc. 99, 1907–1924. doi:10.1175/BAMS-D-16-0236.1 CrossRef Full Text | Google Scholar Clark, A. J., Gao, J., Marsh, P. T., Smith, T., Kain, J. S., Correia, J., et al. (2013). Tornado pathlength forecasts from 2010 to 2011 using ensemble updraft helicity. Wea. Forecast. 28 (2), 387–407. doi:10.1175/WAF-D-12-00038.1 CrossRef Full Text | Google Scholar Clark, A. J., Jirak, I. L., Dembek, S. R., Creager, G. J., Kong, F., Thomas, K. W., et al. (2018). The community leveraged unified ensemble (Clue) in the 2016 Noaa/hazardous weather testbed spring forecasting experiment. Bull. Amer. Meteor. Soc. 99, 1433–1448. doi:10.1175/Bams-D-16-0309.1 CrossRef Full Text | Google Scholar Dahl, J. M., Parker, M. D., and Wicker, L. J. (2014). Imported and storm-generated near-ground vertical vorticity in a simulated supercell. J. Atmos. Sci. 71, 3027–3051. doi:10.1175/JAS-D-13-0123.1 CrossRef Full Text | Google Scholar Dahl, J. M. (2017). Tilting of horizontal shear vorticity and the development of updraft rotation in supercell thunderstorms. J. Atmos. Sci. 74, 2997–3020. doi:10.1175/JAS-D-17-0091.1 CrossRef Full Text | Google Scholar Davies-Jones, R., and Brooks, H. E. (1993). “Mesocyclogenesis from a theoretical perspective,” in The tornado: Its structure, dynamics, prediction, and hazards, meteor. Monogr., No. 79 (Boston, MA: Amer. Meteor. Soc.), 105–114. CrossRef Full Text | Google Scholar Davies-Jones, R. P. (2015). A review of supercell and tornado dynamics. Atmos. Res. 158–159, 274–291. doi:10.1016/j.atmosres.2014.04.007 PubMed Abstract | CrossRef Full Text | Google Scholar Doswell, C. A., and Burgess, D. W. (1993). “Tornadoes and tornadic storms: A review of conceptual models,” in The tornado: Its structure, dynamics, hazards, and prediction, geophys. Monogr., vol. 79 (Washington, D.C: Amer. Geophys. Union), 161–172. CrossRef Full Text | Google Scholar Dowell, D. C., and Bluestein, H. B. (2002). The 8 June 1995 McLean, Texas, storm.Part Ⅱ:Cyclic tornado formation, maintenance, and dissipation. Mon. Wea Rev. 130 (11), 2649–2670. doi:10.1175/1520-0493(2002)1302.0.CO;2 CrossRef Full Text | Google Scholar Fan, J., Zhang, Y., Li, Z., Hu, J., and Rosenfeld, D. (2020). Urbanization-induced land and aerosol impacts on sea-breeze circulation and convective precipitation. Atmos. Chem. Phys. 20, 14163–14182. doi:10.5194/acp-20-14163-2020 CrossRef Full Text | Google Scholar Flournoy, M. D., Coniglio, M. C., Rasmussen, E. N., Furtado, J. C., and Coffer, B. E. (2020). Modes of storm-scale variability and tornado potential in VORTEX2 near- and far-field tornadic environments. Mon. Wea. Rev. 148, 4185–4207. doi:10.1175/MWR-D-20-0147.1 CrossRef Full Text | Google Scholar Gallo, B. T., Clark, A. J., and Dembek, S. R. (2016). Forecasting tornadoes using convection-permitting ensembles. Wea. Forecast. 31, 273–295. doi:10.1175/waf-d-15-0134.1 CrossRef Full Text | Google Scholar Gallo, B. T., Clark, A. J., Smith, B. T., Thompson, R. L., Jirak, I., and Dembek, S. R. (2018). Blended probabilistic tornado forecasts: Combining climatological frequencies with NSSL–WRF ensemble forecasts. Wea. Forecast. 33 (2), 443–460. doi:10.1175/waf-d-17-0132.1 CrossRef Full Text | Google Scholar Gao, J., and O'Neill, B. C. (2020). Mapping global urban land for the 21st century with data-driven simulations and Shared Socioeconomic Pathways. Nat. Commun. 11 (1), 2302. doi:10.1038/s41467-020-15788-7 PubMed Abstract | CrossRef Full Text | Google Scholar Gao, M., Carmichael, G. R., Wang, Y., Saide, P. E., Yu, M., Xin, J., et al. (2016). Modeling study of the 2010 regional haze event in the North China Plain. Atmos. Chem. Phys. 16, 1673–1691. doi:10.5194/acp-16-1673-2016 CrossRef Full Text | Google Scholar Geerts, B., Parsons, D., Ziegler, C. L., Weckwerth, T. M., Biggerstaff, M. I., Clark, R. D., et al. (2017). The (2015), plains elevated convection at night field project. Bull. Amer. Meteor. Soc. 98, 767–786. doi:10.1175/BAMS-D-15-00257.1 CrossRef Full Text | Google Scholar Glickman, T. (2000). Glossary of meteorology. 2nd ed. Boston, MA: Amer. Meteor. Soc., 855. Available at: http://glossary.ametsoc.org/. Google Scholar Grams, J. S., Thompson, R. L., Snively, D. V., Prentice, J. A., Hodges, G. M., and Reames, L. J. (2012). A climatology and comparison of parameters for significant tornado events in the United States. Wea. Forecast. 27, 106–123. doi:10.1175/WAF-D-11-00008.1 CrossRef Full Text | Google Scholar Haberlie, A. M., Ashley, W. S., and Pingel, T. J. (2015). The effect of urbanisation on the climatology of thunderstorm initiation. Quart. J. Roy. Meteor. Soc. 141, 663–675. doi:10.1002/qj.2499 CrossRef Full Text | Google Scholar Hubbart, J. A., Kellner, E., Hooper, L., Lupo, A., Market, P., Guinan, P., et al. (2014). Localized climate and surface energy flux alterations across an urban gradient in the central U.S. Energies 7, 1770–1791. doi:10.3390/en7031770 CrossRef Full Text | Google Scholar Javanroodi, K., and Nik, V. M. (2020). Interactions between extreme climate and urban morphology: Investigating the evolution of extreme wind speeds from mesoscale to microscale. Urban Clim. 31, 100544. doi:10.1016/j.uclim.2019.100544 CrossRef Full Text | Google Scholar Kang, S.-L. (2009). Temporal oscillations in the convective boundary layer forced by mesoscale surface heat-flux variations. Bound.-Layer Meteor. 132, 59–81. doi:10.1007/s10546-009-9391-5 CrossRef Full Text | Google Scholar Kellner, O., and Niyogi, D. (2014). Land surface heterogeneity signature in tornado climatology? An illustrative analysis over Indiana, 1950–2012. Earth Interact. 18 (10), 1–32. doi:10.1175/2013EI000548.1 CrossRef Full Text | Google Scholar Knupp, K. R., Murphy, T. A., Coleman, T. A., Wade, R. A., Mullins, S. A., Schultz, C. J., et al. (2014). Meteorological overview of the devastating 27 April 2011 tornado outbreak. Bull. Am. Meteorol. Soc. 95, 1041–1062. doi:10.1175/bams-d-11-00229.1 CrossRef Full Text | Google Scholar Lemon, L. R., and Doswell, C. A. (1979). Severe thunderstorm evolution and mesocyclone structure as related to tornadogenesis. Mon. Weather Rev. 107 (9), 1184–1197. doi:10.1175/1520-0493(1979)1072.0.Co;2 CrossRef Full Text | Google Scholar Lin, Y., Fan, J., Jeong, J.-H., Zhang, Y., Homeyer, C. R., and Wang, J. (2021). Urbanization-induced land and aerosol impacts on storm propagation and hail characteristics. J. Atmos. Sci. 78, 925–947. doi:10.1175/jas-d-20-0106.1 CrossRef Full Text | Google Scholar Liu, J., and Niyogi, D. (2019). Meta-analysis of urbanization impact on rainfall modification. Sci. Rep. 9, 7301. doi:10.1038/s41598-019-42494-2 PubMed Abstract | CrossRef Full Text | Google Scholar Maddox, R. A. (1980). Meoscale convective complexes. Bull. Am. Meteorol. Soc. 61, 1374–1387. doi:10.1175/1520-0477(1980)0612.0.co;2 CrossRef Full Text | Google Scholar Markowski, P. M., and Richardson, Y. (2010). Mesoscale meteorology in midlatitudes. Chichester, UK: Wiley-Blackwell, 424. doi:10.1002/9780470682104 CrossRef Full Text | Google Scholar Markowski, P. M., and Richardson, Y. P. (2014). The influence of environmental low-level shear and cold pools on tornadogenesis: Insights from idealized simulations. J. Atmos. Sci. 71, 243–275. doi:10.1175/JAS-D-13-0159.1 CrossRef Full Text | Google Scholar Markowski, P. M., Rasmussen, E. N., and Straka, J. M. (1998). The occurrence of tornadoes in supercells interacting with boundaries during VORTEX-95. Weather Forecast 13, 852–859. doi:10.1175/1520-0434(1998)0132.0.CO;2 CrossRef Full Text | Google Scholar Markowski, P. M., Straka, J. M., and Rasmussen, E. N. (2002). Direct surface thermodynamic observations within the rear-flank downdrafts of nontornadic and tornadic supercells. Mon. Weather Rev. 130, 1692–1721. doi:10.1175/1520-0493(2002)1302.0.co;2 CrossRef Full Text | Google Scholar Markowski, P. M. (2002). Hook echoes and rear-flank downdrafts: A review. Mon. Weather Rev. 130, 852–876. doi:10.1175/1520-0493(2002)1302.0.co;2 CrossRef Full Text | Google Scholar Marquis, J., Richardson, Y., Markowski, P., Dowell D, D., and Wurman, J. (2012). Tornado maintenance investigated with high-resolution dual-Doppler and EnKF analysis. Mon. Weather Rev. 140, 3–27. doi:10.1175/MWR-D-11-00025.1 CrossRef Full Text | Google Scholar Martilli, A., Clappier, A., and Rotach, M. W. (2002). An urban surface exchange parameterisation for mesoscale models. Bound.-Layer Meteor. 104, 261–304. doi:10.1023/A:1016099921195 CrossRef Full Text | Google Scholar Miller, R. C. (1972). “Notes on analysis and severe-storm forecasting procedures of the air force global weather central,” in Air weather Service tech. Rep. 200 (rev.) (Springfield, VA: Scott Air Force Base), 190. Google Scholar Nowotarski, C., and Jones, E. (2018). Multivariate self-organizing map approach to classifying supercell tornado environments using near-storm, low-level wind and thermodynamic profiles. Wea. Forecast. 33, 661–670. doi:10.1175/WAF-D-17-0189.1 CrossRef Full Text | Google Scholar Nowotarski, C. J., and Markowski, P. M. (2016). Modifications to the near-storm environment induced by simulated supercell thunderstorms. Mon. Weather Rev. 144 (1), 273–293. doi:10.1175/MWR-D-15-0247.1 CrossRef Full Text | Google Scholar Parker, M. D., and Dahl, J. M. (2015). Production of near-surface vertical vorticity by idealized downdrafts. Mon. Wea. Rev. 143, 2795–2816. doi:10.1175/MWR-D-14-00310.1 CrossRef Full Text | Google Scholar Parker, M. D. (2014). Composite VORTEX2 supercell environments from near-storm soundings. Mon. Wea. Rev. 142 (2), 508–529. doi:10.1175/MWR-D-13-00167.1 CrossRef Full Text | Google Scholar Qian, Y., Chakraborty, T. C., Li, J., Li, D., He, C., Sarangi, C., et al. (2022). Urbanization impact on regional climate and extreme weather: Current understanding, uncertainties, and future research directions. Adv. Atmos. Sci. 39, 819–860. doi:10.1007/s00376-021-1371-9 PubMed Abstract | CrossRef Full Text | Google Scholar Rasmussen, E. N., Richardson, S., Straka, J. M., Markowski, P. M., and Blanchard, D. O. (2000). The association of significant tornadoes with a baroclinic boundary on 2 June 1995. Mon. Wea. Rev. 128, 174–191. CrossRef Full Text | Google Scholar Roberts, B., Xue, M., Schenkman, A. D., and Dawson, D. T. (2016). The role of surface drag in tornadogenesis within an idealized supercell simulation. J. Atmos. Sci. 73, 3371–3395. doi:10.1175/JAS-D-15-0332.1 CrossRef Full Text | Google Scholar Rotunno, R. (1981). On the evolution of thunderstorm rotation. Mon. Wea. Rev. 109, 577–586. doi:10.1175/1520-0493(1981)1092.0.CO;2 CrossRef Full Text | Google Scholar Salamanca, F., and Martilli, A. (2010). A new building energy model coupled with an urban canopy parameterization for urban climate simulations—Part II. Validation with one dimension off-line simulations. Theor. Appl. Climatol. 99, 345–356. doi:10.1007/s00704-009-0143-8 CrossRef Full Text | Google Scholar Schenkman, A. D., Xue, M., and Hu, M. (2014). Tornadogenesis in a high-resolution simulation of the 8 May 2003 Oklahoma City supercell. J. Atmos. Sci. 71, 130–154. doi:10.1175/JAS-D-13-073.1 CrossRef Full Text | Google Scholar Schultz, D. M., Richardson, Y. P., Markowski, P. M., and Doswell, C. A. (2014). Tornadoes in the central United States and the “clash of air masses”. Bull. Am. Meteorol. Soc. 95, 1704–1712. doi:10.1175/BAMS-D-13-00252.1 CrossRef Full Text | Google Scholar Shafer, C. M., Mercer, A. E., Leslie, L. M., Richman, M. B., and Doswell, C. A. (2010). Evaluation of WRF model simulations of tornadic and nontornadic outbreaks occurring in the spring and fall. Mon. Weather Rev. 138, 4098–4119. doi:10.1175/2010MWR3269.1 CrossRef Full Text | Google Scholar Shepherd, J. M. (2005). A review of current investigations of urban-induced rainfall and recommendations for the future. Earth Interact. 9, 1–27. doi:10.1175/EI156.1 CrossRef Full Text | Google Scholar Singh, J., Karmakar, S., PaiMazumder, D., Ghosh, S., and Niyogi, D. (2020). Urbanization alters rainfall extremes over the contiguous United States. Environ. Res. Lett. 15 (7), 074033. doi:10.1088/1748-9326/ab8980 CrossRef Full Text | Google Scholar Sobash, R. A., Romine, G. S., Schwartz, C. S., Gagne, D. J., and Weisman, M. L. (2016). Explicit forecasts of low-level rotation from convection-allowing models for next-day tornado prediction. Wea. Forecast. 31 (5), 1591–1614. doi:10.1175/waf-d-16-0073.1 CrossRef Full Text | Google Scholar Thompson, R. L., Mead, C. M., and Edwards, R. (2007). Effective storm-relative helicity and bulk shear in supercell thunderstorm environments. Wea. Forecast. 22, 102–115. doi:10.1175/WAF969.1 CrossRef Full Text | Google Scholar Thompson, R. L., Smith, B. T., Grams, J. S., Dean, A. R., and Broyles, C. (2012). Convective modes for significant severe thunderstorms in the contiguous United States. Part II: Supercell and QLCS tornado environments. Wea. Forecast. 27, 1136–1154. doi:10.1175/WAF-D-11-00116.1 CrossRef Full Text | Google Scholar Tippett, M. K., Sobel, A. H., and Camargo, S. J. (2012). Association of U.S. tornado occurrence with monthly environmental parameters. Geophys. Res. Lett. 39, L02801. doi:10.1029/2011GL050368 CrossRef Full Text | Google Scholar Tippett, M. K. (2018). Robustness of relations between the MJO and U.S. tornado occurrence. Mon. Wea. Rev. 146, 3873–3884. doi:10.1175/MWR-D-18-0207.1 CrossRef Full Text | Google Scholar Wade, A. R., Coniglio, M. C., and Ziegler, C. L. (2018). Comparison of near- and far-field supercell inflow environments using radiosonde observations. Mon. Weather Rev. 146 (8), 2403–2415. doi:10.1175/MWR-D-17-0276.1 CrossRef Full Text | Google Scholar Wakimoto, R. M. (1982). The life cycle of thunderstorm gust fronts as viewed with Doppler radar and Rawinsonde data. Mon. Wea. Rev. 110 (8), 1060–1082. doi:10.1175/1520-0493(1982)1102.0.co;2 CrossRef Full Text | Google Scholar Wurman, J., and Kosiba, K. (2013). Finescale radar observations of tornado and mesocyclone structures. Weather Forecast 28, 1157–1174. doi:10.1175/WAF-D-12-00127.1 CrossRef Full Text | Google Scholar Wurman, J., Alexander, C., Robinson, P., and Richardson, Y. (2007). Low-Level winds in tornadoes and potential catastrophic tornado impacts in urban areas. Bull. Am. Meteorol. Soc. 88, 31–46. doi:10.1175/BAMS-88-1-31 CrossRef Full Text | Google Scholar Wurman, J., Dowell, D., Richardson, Y., Markowski, P., Rasmussen, E., Burgess, D., et al. (2012). The second verification of the origins of rotation in tornadoes experiment: VORTEX2. Bull. Am. Meteorological Soc. 93, 1147–1170. doi:10.1175/BAMS-D-11-00010.1 CrossRef Full Text | Google Scholar Keywords: urbanization, supercell, tornado potential, WRF simulation, tornadogenesis Citation: Fan J, Wang J and Lin Y (2023) Urbanization may enhance tornado potential: A single case report. Front. Earth Sci. 11:1148506. doi: 10.3389/feart.2023.1148506 Received: 20 January 2023; Accepted: 10 April 2023;Published: 18 April 2023. Edited by: Jianhua SUN, Chinese Academy of Sciences (CAS), ChinaReviewed by: Liping Luo, Nanjing University of Aeronautics and Astronautics, ChinaLingkun Ran, Chinese Academy of Sciences (CAS), ChinaCopyright © 2023 Fan, Wang and Lin. This is an open-access article distributed under the terms of the Creative Commons Attribution License (CC BY). The use, distribution or reproduction in other forums is permitted, provided the original author(s) and the copyright owner(s) are credited and that the original publication in this journal is cited, in accordance with accepted academic practice. No use, distribution or reproduction is permitted which does not comply with these terms. *Correspondence: Jiwen Fan, [email protected]; Jingyu Wang, [email protected] This article is part of the Research TopicObservation Characteristics and Formation Mechanisms of Severe Weather Events View all 8 Articles |
【本文地址】